Wednesday, December 5, 2018

Convolutional-Neural-Network-using-keras

In this article, I explain the implementation of Convolutional Neural Network (CNN) using Keras frame work in python. Keras is a high level neural network API to build deep learning models. Now a days, deep learning models have achieved promising results in many tasks in the field of computer vision. CNN is a kind of deep learning model and achieved promising results in image classification tasks. In other words, CNN acts as a powerful image classifier. This article explains the implementation of CNN using keras for hand written digit classification task. Remember, deep networks are the data driven models, i.e., more data is needed for training a deep neural network. For my explanation, I am using MNIST dataset for the hand written digit classification task.

About MNIST dataset:

This dataset contains 60000, 10000 instances in the Training and Testing sets respectively. The following code snippet loads the MNIST dataset in keras. The variables data_train and data_test contains data instances of digits in training and testing sets, where as label_train and label_test stores the labels of training and testing data instances.

#load training and testing data
from keras.datasets import mnist
(data_train, label_train), (data_test, label_test) = mnist.load_data()

We can view the dimensions of variables using the following python code snippet.

#printing dimensions of variables
print(data_train.shape,data_test.shape)

output of the above code snippet: (60000, 28, 28) (10000, 28, 28) From the above output, we have to understand that the training instances are 60000 and testing instances are 10000 respectively. Each data instance (image) dimension is 28 x 28, i.e., training and testing data instances are gray scale images. The following code snippet will be helpful to visualize the images in training and testing sets. It will display four random images in training set.

#displaying the random digits
rand1 = random.randint(1,60000)
rand2 = random.randint(1,60000)
rand3 = random.randint(1,60000)
rand4 = random.randint(1,60000)
cv2.imshow('digit',data_train[rand1])
cv2.waitKey(500)
cv2.imshow('digit',data_train[rand2])
cv2.waitKey(500)
cv2.imshow('digit',data_train[rand3])
cv2.waitKey(500)
cv2.imshow('digit',data_train[rand4])
cv2.waitKey(200)

Since we are working with gray scale images, it is necessary to reshape as explained in following code snippet. In other words, we have to reshape the 28 x 28 images into 28 x 28 x 1 images.

#reshape training and testing data to train and test model
data_train = data_train.reshape(60000,28,28,1)
data_test = data_test.reshape(10000,28,28,1)

In general, we are using class labels are integers (1,2,3,...). It is necessary to convert integers into binary class matrix (i.e. called as one hot encoding). The following code converts integer class labels into binary class matrix labels.

from keras.utils import to_categorical
#one-hot encoding of training and testing labels
y_train = to_categorical(label_train)
y_test = to_categorical(label_test)

Now, this is time for designing CNN for classification task. Here, I have chosen three convolution layers and each layer is followed by activation layer RELU. Then, one fully connected layer and softmax layers are added at the end for classification tasks.

from keras.models import Sequential
from keras.layers import Dense, Conv2D, Flatten
#create model
model = Sequential()
#add model layers
model.add(Conv2D(64, kernel_size=3, activation='relu', input_shape=(28,28,1)))
model.add(Conv2D(32, kernel_size=3, activation='relu'))
model.add(Flatten())
model.add(Dense(10, activation='softmax'))

Now, we have to compile the model to measure the model performance as shown below and then training the model with the chosen options.

#compile model 
model.compile(optimizer='adam', loss='categorical_crossentropy', metrics=['accuracy'])

#training the model
model.fit(data_train, y_train, validation_data=(data_test, y_test),  epochs=1)


with the single epoch, we got validation accuracy on MNIST dataset is 97.93. This is great. By increasing number of epochs, accuracy may increase.
output:
loss: 0.3824 - acc: 0.9464 - val_loss: 0.0693 - val_acc: 0.9793

Friday, March 2, 2018

convolution

Convolution operation plays a vital role in image processing. This is used in many applications in image processing, such as blurring, sharpening, embossing and edge detection etc. By studying this article, one can understand the concept of Convolution operation in image processing in theoretical and practical manner. In addition, it explains the differences between convolution and correlation operations in mathematical and practical manner.

Before understanding the convolution operation, first let me explain the correlation operation in theoretical and mathematical manner. If we want to apply correlation or convolution operation in image processing, we have to define a kernel . The kernel is a small matrix. In general, the kernel is square matrix and the dimension is in odd, for example, 3 x 3, 5 x 5, 7 x 7 ........ etc. The following 3 X 3 kernel has been taken to explain the correlation and convolution operations in this article.

Correlation

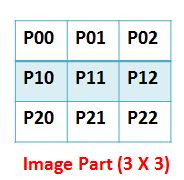
correlation is the process of adding each element of the image to its local neighbors by the weighted kernel. For better understanding, the part of image of size 3 x 3 has been taken as follows.
The correlation is the process of finding the sum of product of similar entries between the kernel and part of the image. Mathematically, it can be expressed as depicted in Equation 1.
In the resulting image, the element at coordinates [1,1] is updated with the resultant value of correlation as shown in Equation 1. This process is subsequently applied to find the rest of the values of elements in the resulting image as depicted in following.


Popular Articles:

1. matlab-cropping-binary-image-algorithm

Objective of the Program: Program takes a black and white image as input. It removes the black portion and gives the white portion of the image.

2. Working-with-ROI-of-image-using-Matlab

Objective of the Program:The part of the image, on which you have interest to work out, is called Region of Interest (ROI). In another words, selected subset of image is called ROI. In some contexts, you want to apply operations on ROI of image rather than the entire image. To achieve this, generally people extract the ROI from the image, store it in another variable and then apply operations on ROI. If you want to apply your operations on ROI without extracting from the image, it is bit difficult. This article will explain the performing the operations on ROI without extracting from the image. In this context, the ROI part of image is affected rather than the entire image.

Wednesday, February 21, 2018

Sobel-Edge-Detection

Sobel-Edge-Detection

If the reader does not know the convolution operation, click this link to understand the convolution operation in image processing: convolution.This article illustrates the how to implement Sobel edge detection without using predefined function. It is very simple to understand and implement. The function naveenSobelXgradient() calculates the horizontal derivative approximation and naveenSobelYgradient() calculates the vertical derivative approximation. Both these functions use the 3 x 3 kernels of Sobel edge detection as shown in following. The function naveenConvolve() do convolution operation between kernels and input image. After finding the X and Y gradients, the gradient magnitude is calculated using either [imgx2 + imgy2] or [abs(imgx) + abs(imgy)]. Here, imgx and imgy are X and Y gradients of given image img. We have used the latter one for calculating sobel edge detection. Python with openCV is used for reading the image file but sobel edge detection is done by the user defined function.

Sobel Kernels for Edge detection

Requirements for execution of code

  1. Python (numpy package)
  2. Opencv (Cv2 package)

Python Code

# Developer : M NAVEENKUMAR, a Research Scholar, Department of Computer Applications, NIT Trichy, Tamilnadu, India
# Objective of this program is to implement sobel edge detection without using Predefined functions.
import numpy as np
import cv2

#a function for convolution operation
def naveenConvolve(img,kernel):
    row1total = img[0,1]*kernel[0,1] + img[0,2]*kernel[0,2] + img[0,0]*kernel[0,0]
    row2total = 0
    row3total = img[2,1]*kernel[2,1] + img[2,2]*kernel[2,2] + img[2,0]*kernel[2,0]
    return row1total + row2total + row3total

#a function for taking part of image to apply convolution between kernel and part of image
def takePartImage(inpimg,i,j):
    image = np.zeros((3,3))
    a = i
    b = j
    for k in range(0,3):
        b = j
        for l in range(0,3):
            image[k,l] = inpimg[a,b]
            b = b+1
        a = a +1
    return image

#a function for finding X gradient
def naveenSobelXgradient(inputimg):
    rows = len(inputimg)
    cols = len(inputimg[0])
    Gx = np.array(np.mat('1 0 -1; 2 0 -2; 1 0 -1'))
    outputimg = np.zeros((rows,cols))
    for i in range(0,rows-3):
         for j in range(0,cols-3):
             # retreve the part of image of 3 x 3 dimension from inputimage
             image  = takePartImage (inputimg, i, j)
             outputimg[i,j] = naveenConvolve(image,Gx)
    return outputimg

#a function for finding Y gradient
def naveenSobelYgradient(inputimg):
    rows = len(inputimg)
    cols = len(inputimg[0])
    #print(rows,cols)
    Gy = np.array(np.mat('1 2 1; 0 0 0; -1 -2 -1'))
    outputimg = np.zeros((rows,cols))
    for i in range(0,rows-3):
         for j in range(0,cols-3):
             # retreve the part of image of 3 x 3 dimension from inputimage
             image  = takePartImage (inputimg, i, j)
             outputimg[i,j] = naveenConvolve(image,Gy)
    return outputimg

#reading an image 
inputimg = cv2.imread('Image path',0);

sobelimagex = naveenSobelXgradient(inputimg)
sobelimagey = naveenSobelYgradient(inputimg)

rows = len(inputimg)
cols = len(inputimg[0])

outputimg = np.zeros([rows, cols])

#finding the gradient magnitude by using the formula [abs(imgx) + abs(imgy)]
for i in range(0,rows):
    for j in range(0,cols):
        outputimg[i,j] = abs(sobelimagex[i, j]) + abs(sobelimagey[i, j])

print(outputimg.size)

cv2.imshow('sobel image',np.uint8(outputimg))
cv2.waitKey(0)

Output

Input image Sobel Output


Follow us on Facebook :


Popular Articles:

1. matlab-cropping-binary-image-algorithm

Objective of the Program: Program takes a black and white image as input. It removes the black portion and gives the white portion of the image.

2. Working-with-ROI-of-image-using-Matlab

Objective of the Program:The part of the image, on which you have interest to work out, is called Region of Interest (ROI). In another words, selected subset of image is called ROI. In some contexts, you want to apply operations on ROI of image rather than the entire image. To achieve this, generally people extract the ROI from the image, store it in another variable and then apply operations on ROI. If you want to apply your operations on ROI without extracting from the image, it is bit difficult. This article will explain the performing the operations on ROI without extracting from the image. In this context, the ROI part of image is affected rather than the entire image.

Python-environment-for-deep-learning-in-windows

Python is increasingly becoming a popular programming language for machine learning and deep learning. If you want to use python for train...